Ecommerce Analytics for Brands Attending Shoptalk 2025: What to Ask Before You Walk the Floor
by Trivas.ai
|
7 min read
Oct 09, 2026
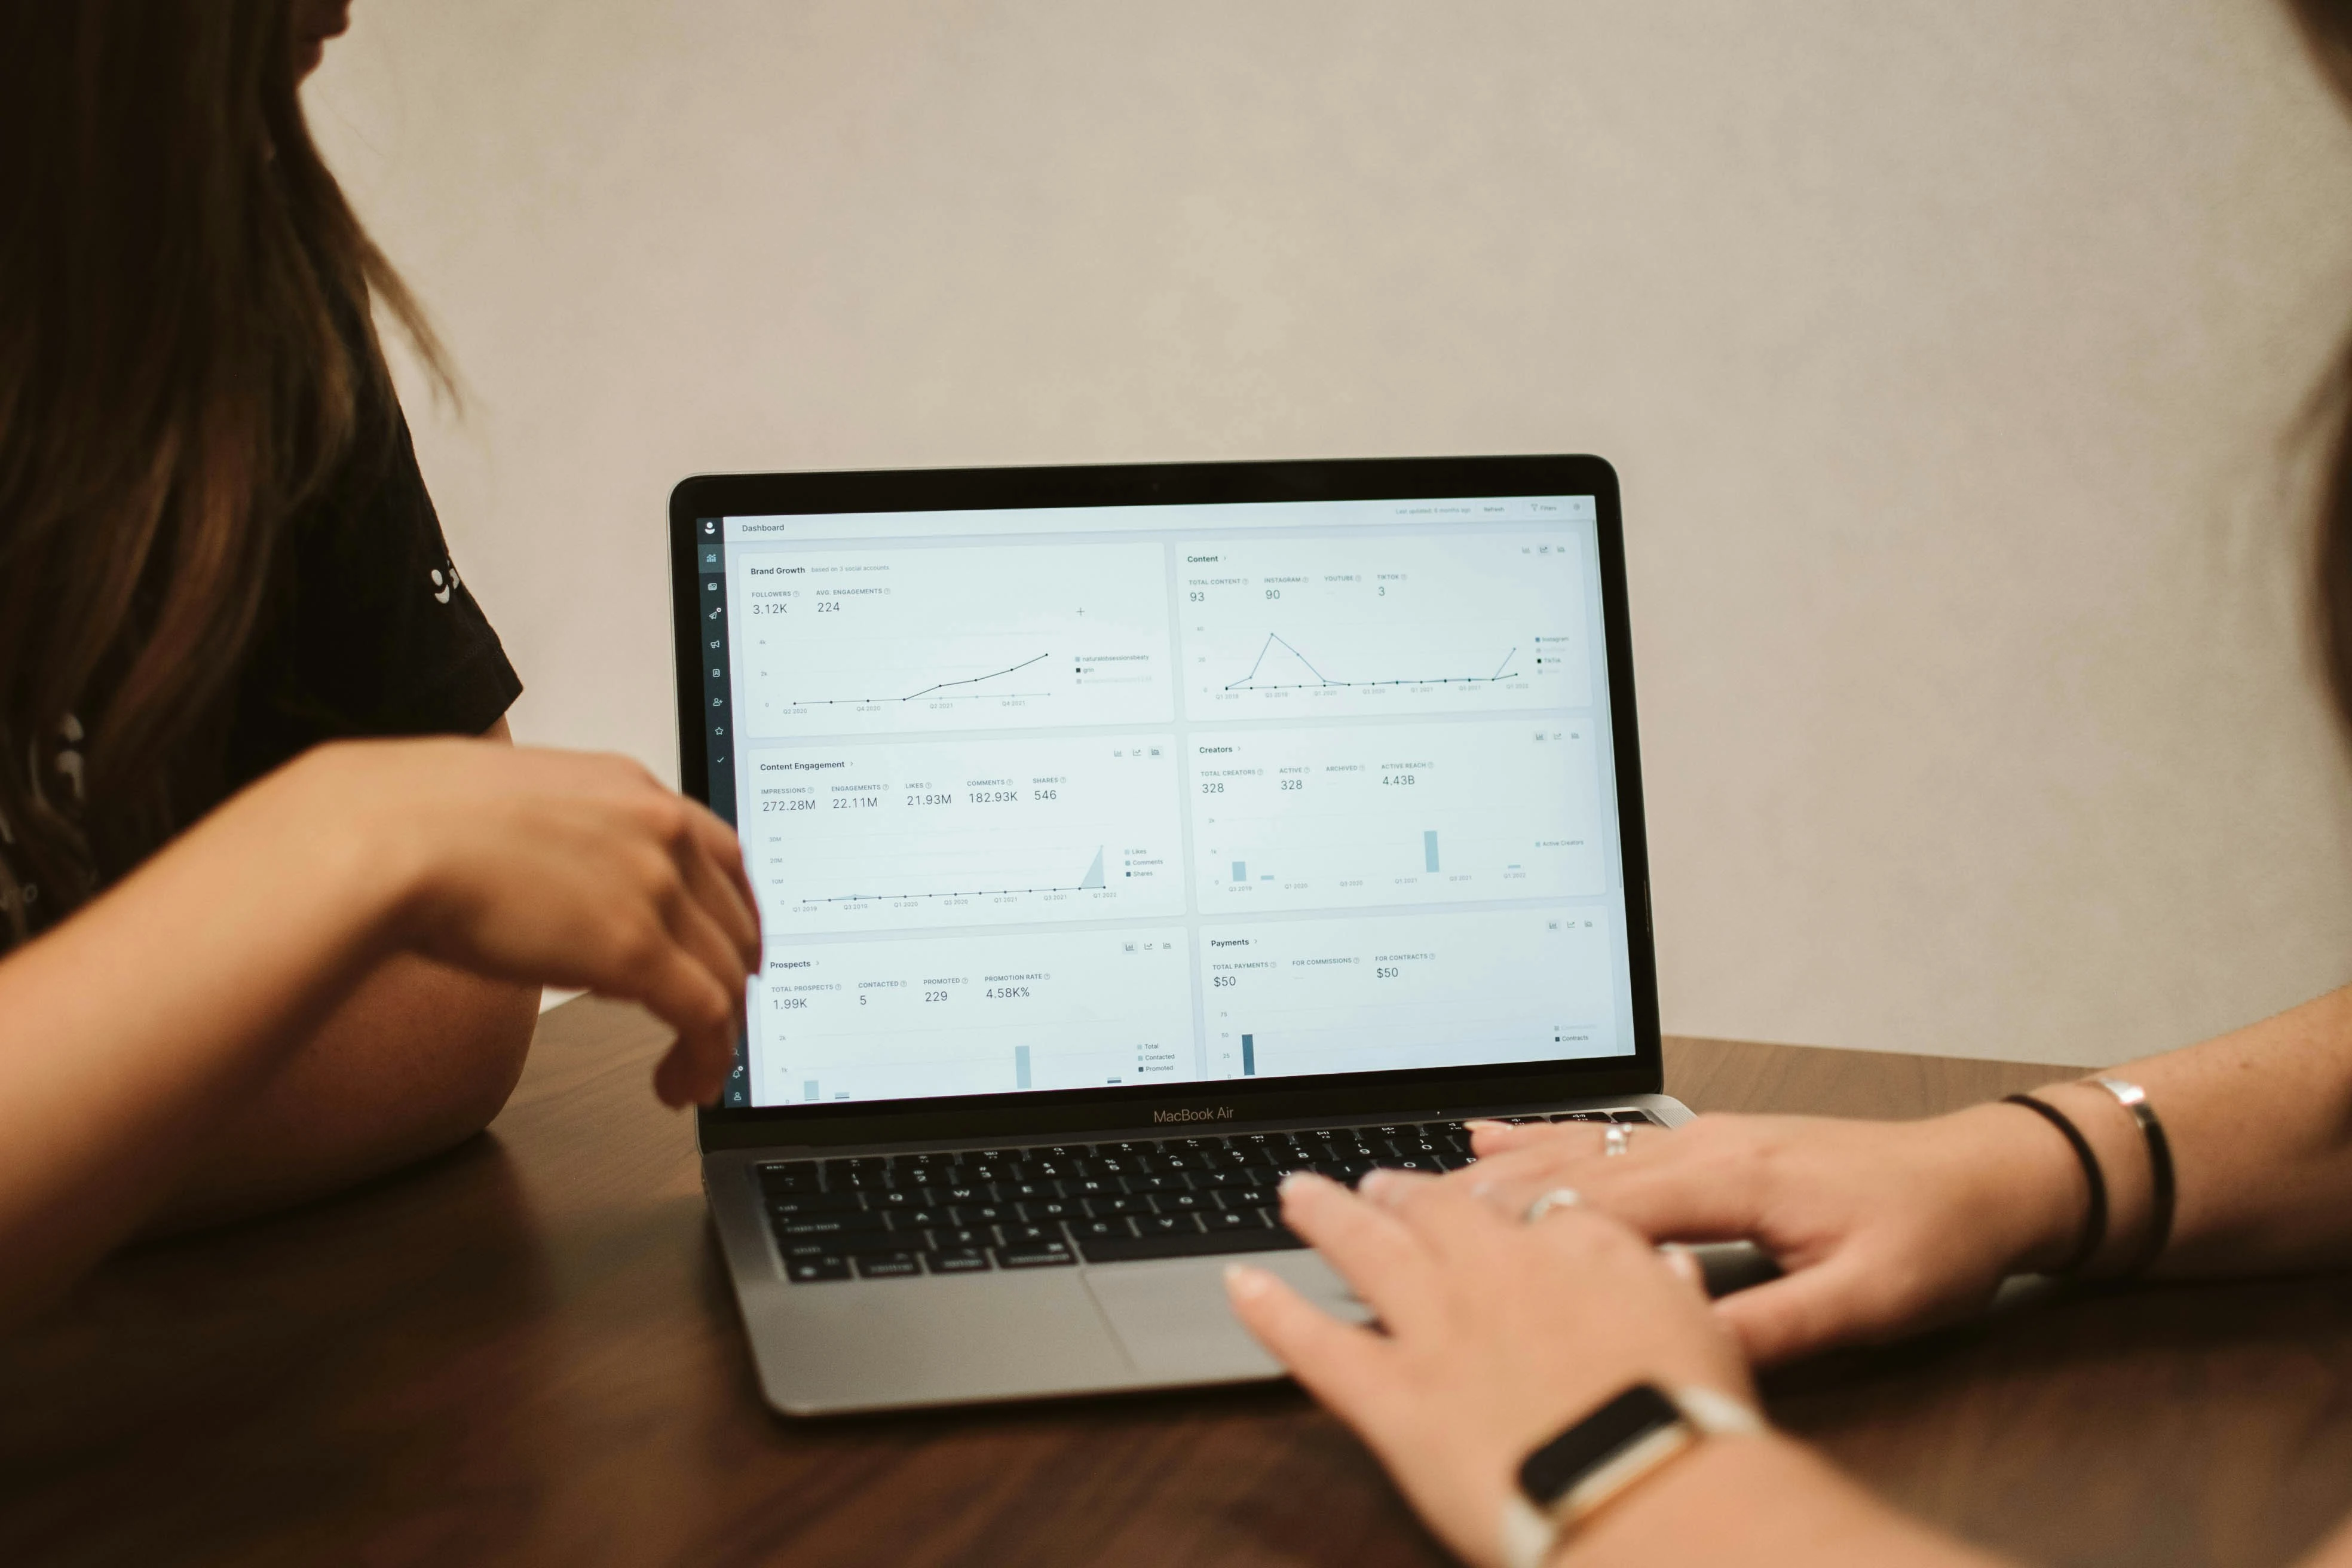
Shoptalk 2025 will have a few hundred vendors on the floor, and most of them are pitching some version of the same thing: one dashboard to rule them all. Your Amazon data, your Shopify data, your ad spend, your funnel metrics, all in one tidy view. Sounds great in a 10-minute demo. It sounds the same in every booth, too.
Here's the actual problem. Brands walk out of Shoptalk with six demos booked for the following week and no real way to compare them. Everyone shows the same clean dashboard screenshot. Nobody shows you what happens when your data gets messy, your SKU count grows, or your ad spend crosses six figures a month.
This page is a buyer's checklist for ecommerce analytics for brands attending Shoptalk 2025, plus a straight answer on where Trivas fits if you're running Shopify, Amazon, or both and scaling past six figures a month. Trivas will be on the floor this year. If you want to get a walkthrough scheduled ahead of time rather than waiting in a booth line, the events hub has the details.
Quick Shoptalk 2025 Rundown for Analytics Buyers
For data and reporting specifically, expect a heavy lean into AI-driven decisioning, unified commerce data, and retail media measurement. Those three themes show up in half the session titles every year, and 2025 isn't going to be different. The retail media piece in particular is getting louder as more brands pour spend into Amazon Ads and retailer-owned networks.
On the brand side, the people actually walking the floor tend to be founders, growth leads, and data analysts who've been told to "go look at what's out there" for stack consolidation. Not casual browsers. People with a specific pain point and a budget line they're trying to justify.
Almost everyone shows up already running Shopify, Amazon Seller Central, and Meta or Google ads in parallel, usually with GA4 bolted on for funnel tracking. That fragmentation is exactly what every analytics vendor on the floor claims to fix. The pitch is identical across booths. The execution isn't.
If Shoptalk isn't the only event on your radar this year, the events page tracks a few others worth knowing about through 2026, including the European edition.
The Reporting Problem Shoptalk Pitches Won't Mention
Here's what the demo doesn't show you: pulling Amazon, Shopify, Meta, and GA4 data into one reconciled view still eats 3+ hours a week for most teams, manually, even with a tool installed. Someone is still exporting CSVs, checking for currency mismatches, re-pulling a report because yesterday's Amazon numbers didn't match what's in Seller Central today.
Dashboard demos look identical on a trade show floor because they're built for the demo. Clean sample data, no edge cases, no three-month-old attribution window acting up. The divergence shows up later, once you're reconciling real numbers at real volume, with real gaps in what each platform reports.
This is where the structural question matters more than the UI. Is the vendor's data warehoused, or is it pulled live via API every time you load a dashboard? Live API pulls are fine at low volume. They start to lag, break, or time out once you've got a year of order history and five ad accounts feeding in. A proper warehouse (Redshift-backed setups are common for this) keeps historical queries fast regardless of how much data has piled up.
That's the real dividing line between vendors. Not the dashboard skin. The plumbing underneath it.
5 Questions to Ask Every Analytics Vendor on the Shoptalk Floor
Bring these five questions to every booth. They cut through the sales deck fast.
How is data stored, live API pull or warehoused? This affects both speed and historical accuracy. Ask what happens to a 12-month trend report once your order volume triples.
What's the actual setup time from signup to first usable dashboard? Not the marketing number on the slide. Ask how long it took their last three customers specifically, and what broke along the way.
Does forecasting use your historical data, or a generic model with no brand-specific tuning? A forecast trained on "ecommerce in general" isn't a forecast for your brand. It's a guess dressed up with a confidence interval.
Can a non-analyst on your team ask a plain-English question and get an answer? Or does every custom report require a support ticket and a 48-hour wait? This matters more than people expect once the data team is stretched thin.
What's the real cost at your current ad spend and SKU count, once you're past the entry tier? Entry pricing on these tools is almost always a loss leader. Ask for the number at your actual volume, not the published starting price.
Write the answers down booth to booth. You'll be surprised how fast the "we're basically the same" feeling falls apart once you have real answers side by side.
How Trivas Answers Those Same Questions
On data architecture: Trivas dashboards run on Amazon Redshift, not live API calls reassembled every time you open a report. That matters once your data volume grows, because historical reporting stays fast instead of slowing down as you scale.
On setup time: the connectors for Shopify, Amazon, Meta, Google Ads, and GA4 are pre-built, not custom-configured per account. That's what actually shortens the gap between signup and a usable first dashboard, rather than a generic "fast onboarding" claim with no mechanism behind it. For the Shopify side specifically, Trivas AI on the Shopify App Store is the direct install path if you want to see the connector before a call.
On forecasting: the AI-driven forecasting is trained on the brand's own sales and ad history, not a generic category model applied across every customer. If your product mix or seasonality is unusual, that distinction shows up fast in forecast accuracy. More detail on how that works is on the forecasting and simulation page.
On the insights layer: the Wingman AI layer is built so a non-analyst can ask a plain-English question about performance and get an answer, instead of filing a ticket and waiting on someone else's queue.
On reporting time: for teams pulling cross-channel numbers weekly, this setup cuts the reporting workflow from roughly 3 hours down to about 20 minutes. That's the BI reporting layer doing the reconciliation work that used to be manual.
If you're running on Shopify, Amazon, or both, the platform-specific pages for Shopify and Amazon cover the integration details in more depth than a booth conversation usually allows.
If You're Already Comparing Triple Whale, Northbeam, or Polar at Shoptalk
These are the three tools most brands have already demoed before they even get to the Shoptalk floor. Fair enough, they're the obvious first calls.
One honest distinction worth naming here: a brand running pure Shopify DTC has a different reconciliation problem than one running Shopify plus an Amazon marketplace operation side by side. The marketplace side adds a layer of fee structures, ad types, and inventory logic that a DTC-only tool often wasn't built to handle. Ask which one you're actually optimizing for before you pick a vendor based on a Shopify-only demo.
Meet Trivas at Shoptalk 2025
If you'd rather not gamble on a random booth drop-by, you can book a 15-minute walkthrough during the event instead. It's a faster way to get a real answer than standing in line hoping a rep has five free minutes between other conversations.
Worth bringing your current reporting stack questions with you, specifically what you're running across Shopify, Amazon, and your ad platforms, so the walkthrough can address your setup directly instead of a generic deck.
If the event schedule doesn't line up, you don't need to wait for Shoptalk to get an answer. Start a trial or talk to a founder directly, either works if you'd rather skip the show floor entirely.
And if you want more of this kind of straight comparison before your next conference, it's worth keeping an eye on what else gets published here between now and the event.
Content author and contributor at Trivas.ai, sharing insights on e-commerce analytics, business intelligence, and data-driven strategies to help businesses grow.
Continue Reading
explore more insights
Implementation Strategies for Cohort Analysis Success
3 min read
Best Triple Whale Alternative for a $5M Shopify Brand
3 min read
Ecommerce Analytics for Brands in Growth Mode: Built to Scale Past Spreadsheets

 by Trivas.ai